Signal Data Calculation, Extraction and Plotting
All the Q & A’s are queries that work on the ae_emuDB that comes with the emuR package:
course_data_dir = "./myEMURdata" # change to valid dir path on your system
library(tidyverse)
library(emuR)
create_emuRdemoData(course_data_dir)
db = load_emuDB(file.path(course_data_dir, "emuR_demoData", "ae_emuDB"),
                verbose = F)
Q & A’s
Signal Data Extraction
Please place your answers in the R Markdown code blocks or write the answers next to the A:
- Q: What are the names of all SSFF tracks contained in the ae_emuDB and what two emuR function can you use to get this information?
- A: dft + fm
summary(db)## Name: ae
## UUID: 0fc618dc-8980-414d-8c7a-144a649ce199
## Directory: /tmp/WP_4.1/myEMURdata/emuR_demoData/ae_emuDB
## Session count: 1
## Bundle count: 7
## Annotation item count: 736
## Label count: 844
## Link count: 785
##
## Database configuration:
##
## SSFF track definitions:
##   name columnName fileExtension
## 1  dft        dft           dft
## 2   fm         fm           fms
##
## Level definitions:
## name type nrOfAttrDefs attrDefNames
## 1 Utterance ITEM 1 Utterance;
## 2 Intonational ITEM 1 Intonational;
## 3 Intermediate ITEM 1 Intermediate;
## 4 Word ITEM 3 Word; Accent; Text;
## 5 Syllable ITEM 1 Syllable;
## 6 Phoneme ITEM 1 Phoneme;
## 7 Phonetic SEGMENT 1 Phonetic;
## 8 Tone EVENT 1 Tone;
## 9 Foot ITEM 1 Foot;
##
## Link definitions:
## type superlevelName sublevelName
## 1 ONE_TO_MANY Utterance Intonational
## 2 ONE_TO_MANY Intonational Intermediate
## 3 ONE_TO_MANY Intermediate Word
## 4 ONE_TO_MANY Word Syllable
## 5 ONE_TO_MANY Syllable Phoneme
## 6 MANY_TO_MANY Phoneme Phonetic
## 7 ONE_TO_MANY Syllable Tone
## 8 ONE_TO_MANY Intonational Foot
## 9 ONE_TO_MANY Foot Syllable# or
list_ssffTrackDefinitions(db)## name columnName fileExtension
## 1 dft dft dft
## 2 fm fm fms- Q: The ae_emuDB contains a SSFF track definition called dft. How many track columns (T1-Tn) do you get if you extract this track for any given segment list? Why so many?
- A:
sl = query(db, "Phonetic == n") # query any segment
td = get_trackdata(db, sl, ssffTrackName = "dft")
##
## INFO: parsing 12 dft segments/events
##
|
| | 0%
|
|====== | 8%
|
|============ | 17%
|
|================== | 25%
|
|======================= | 33%
|
|============================= | 42%
|
|=================================== | 50%
|
|========================================= | 58%
|
|=============================================== | 67%
|
|==================================================== | 75%
|
|========================================================== | 83%
|
|================================================================ | 92%
|
|======================================================================| 100%
## INFO: adding fs attribute to trackdata$data fieldscolnames(td) # -> T1 - T257 ## [1] "sl_rowIdx" "labels" "start"
## [4] "end" "db_uuid" "session"
## [7] "bundle" "start_item_id" "end_item_id"
## [10] "level" "attribute" "start_item_seq_idx"
## [13] "end_item_seq_idx" "type" "sample_start"
## [16] "sample_end" "sample_rate" "times_orig"
## [19] "times_rel" "times_norm" "T1"
## [22] "T2" "T3" "T4"
## [25] "T5" "T6" "T7"
## [28] "T8" "T9" "T10"
## [31] "T11" "T12" "T13"
## [34] "T14" "T15" "T16"
## [37] "T17" "T18" "T19"
## [40] "T20" "T21" "T22"
## [43] "T23" "T24" "T25"
## [46] "T26" "T27" "T28"
## [49] "T29" "T30" "T31"
## [52] "T32" "T33" "T34"
## [55] "T35" "T36" "T37"
## [58] "T38" "T39" "T40"
## [61] "T41" "T42" "T43"
## [64] "T44" "T45" "T46"
## [67] "T47" "T48" "T49"
## [70] "T50" "T51" "T52"
## [73] "T53" "T54" "T55"
## [76] "T56" "T57" "T58"
## [79] "T59" "T60" "T61"
## [82] "T62" "T63" "T64"
## [85] "T65" "T66" "T67"
## [88] "T68" "T69" "T70"
## [91] "T71" "T72" "T73"
## [94] "T74" "T75" "T76"
## [97] "T77" "T78" "T79"
## [100] "T80" "T81" "T82"
## [103] "T83" "T84" "T85"
## [106] "T86" "T87" "T88"
## [109] "T89" "T90" "T91"
## [112] "T92" "T93" "T94"
## [115] "T95" "T96" "T97"
## [118] "T98" "T99" "T100"
## [121] "T101" "T102" "T103"
## [124] "T104" "T105" "T106"
## [127] "T107" "T108" "T109"
## [130] "T110" "T111" "T112"
## [133] "T113" "T114" "T115"
## [136] "T116" "T117" "T118"
## [139] "T119" "T120" "T121"
## [142] "T122" "T123" "T124"
## [145] "T125" "T126" "T127"
## [148] "T128" "T129" "T130"
## [151] "T131" "T132" "T133"
## [154] "T134" "T135" "T136"
## [157] "T137" "T138" "T139"
## [160] "T140" "T141" "T142"
## [163] "T143" "T144" "T145"
## [166] "T146" "T147" "T148"
## [169] "T149" "T150" "T151"
## [172] "T152" "T153" "T154"
## [175] "T155" "T156" "T157"
## [178] "T158" "T159" "T160"
## [181] "T161" "T162" "T163"
## [184] "T164" "T165" "T166"
## [187] "T167" "T168" "T169"
## [190] "T170" "T171" "T172"
## [193] "T173" "T174" "T175"
## [196] "T176" "T177" "T178"
## [199] "T179" "T180" "T181"
## [202] "T182" "T183" "T184"
## [205] "T185" "T186" "T187"
## [208] "T188" "T189" "T190"
## [211] "T191" "T192" "T193"
## [214] "T194" "T195" "T196"
## [217] "T197" "T198" "T199"
## [220] "T200" "T201" "T202"
## [223] "T203" "T204" "T205"
## [226] "T206" "T207" "T208"
## [229] "T209" "T210" "T211"
## [232] "T212" "T213" "T214"
## [235] "T215" "T216" "T217"
## [238] "T218" "T219" "T220"
## [241] "T221" "T222" "T223"
## [244] "T224" "T225" "T226"
## [247] "T227" "T228" "T229"
## [250] "T230" "T231" "T232"
## [253] "T233" "T234" "T235"
## [256] "T236" "T237" "T238"
## [259] "T239" "T240" "T241"
## [262] "T242" "T243" "T244"
## [265] "T245" "T246" "T247"
## [268] "T248" "T249" "T250"
## [271] "T251" "T252" "T253"
## [274] "T254" "T255" "T256"
## [277] "T257"Why so many?: spectral data -> a single amplitude value for every frequency band
- Q: Add a new track to the ae_emuDB called ‘fund_freq’ using the add_ssffTrackDefinition() function using the ksvF0 wrassp function?
- A:
add_ssffTrackDefinition(db, name = "fund_freq", onTheFlyFunctionName = "ksvF0")##
## INFO: applying f0ana to 7 files
##
|
| | 0%
|
|========== | 14%
|
|==================== | 29%
|
|============================== | 43%
|
|======================================== | 57%
|
|================================================== | 71%
|
|============================================================ | 86%
|
|======================================================================| 100%- Q: Remove the previously added track including the files assosiated with it.
- A:
remove_ssffTrackDefinition(db, name = "fund_freq", deleteFiles = T)- Q: If a certain type of data isn’t present in an emuDB (e.g. formants), what two possibilities are there to generate them for a given segment list?
A: 1.) add a new track using add_ssffTrackDefinition with the onTheFlyFunctionName parameter 2.) use get_trackdata with onTheFlyFunctionName
- Q: What is the name of the SSFF track definition that is always present in every emuDB?
A: MEDIAFILE_SAMPLES
Signal Data Visualization
- Q: Plot the original F2 contours contained in the fm track of every ‘n’ segment on the Phonetic level.
- A:
sl = query(db, "Phonetic == n")
td = get_trackdata(db, seglist = sl, ssffTrackName = "fm")
##
## INFO: parsing 12 fms segments/events
##
|
| | 0%
|
|====== | 8%
|
|============ | 17%
|
|================== | 25%
|
|======================= | 33%
|
|============================= | 42%
|
|=================================== | 50%
|
|========================================= | 58%
|
|=============================================== | 67%
|
|==================================================== | 75%
|
|========================================================== | 83%
|
|================================================================ | 92%
|
|======================================================================| 100%ggplot(td) +
aes(x = times_rel, y = T2, col = labels, group = sl_rowIdx) +
geom_line()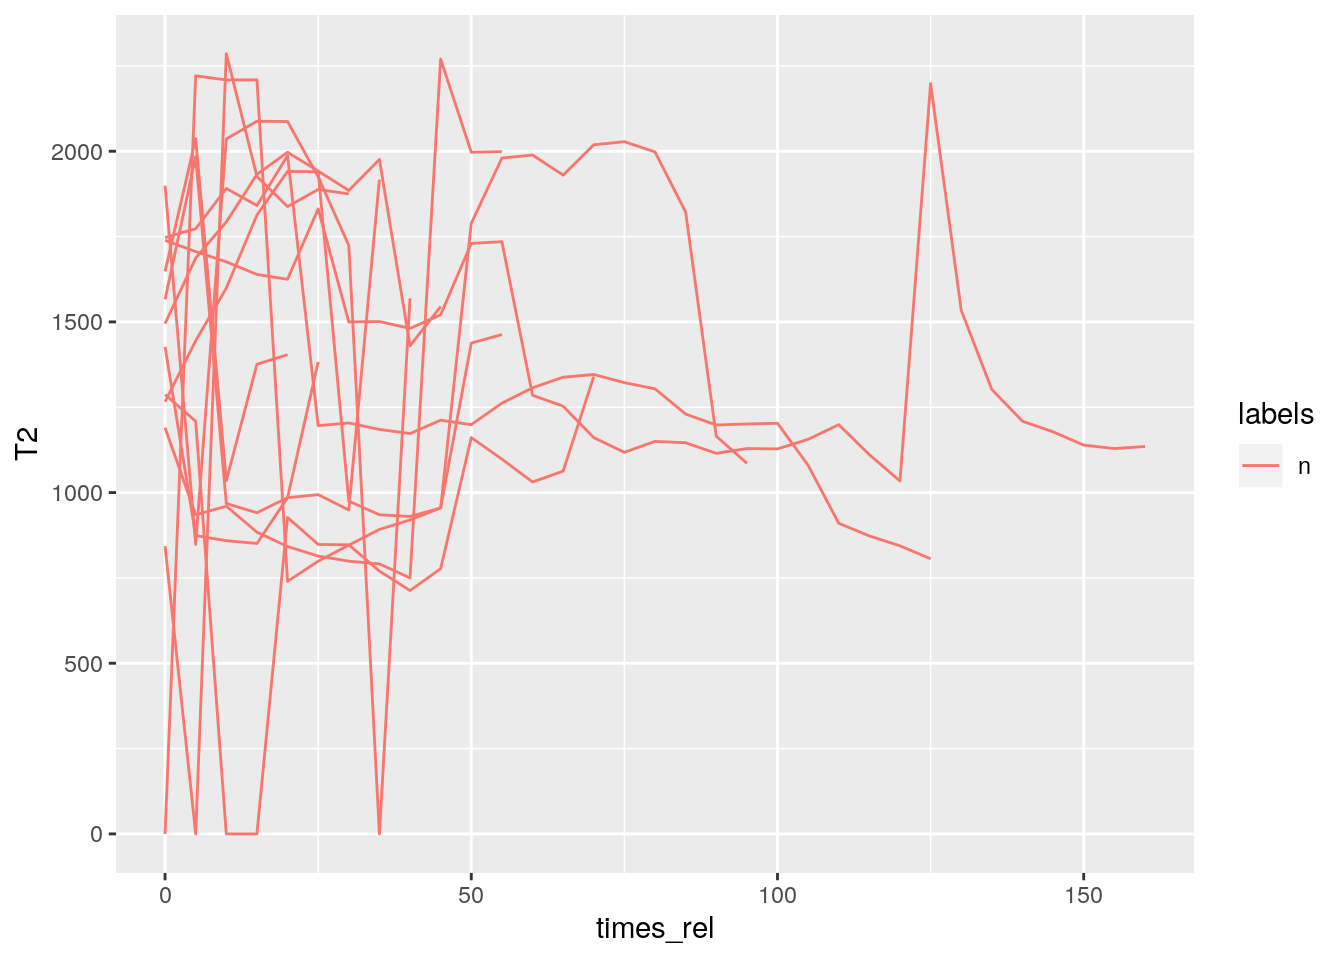
- Q: Plot the F0 contours of every ‘n’ segment on the Phonetic level. (No track available? What to do?)
- A:
sl = query(db, "Phonetic == n")
td = get_trackdata(db, seglist = sl, onTheFlyFunctionName = "ksvF0")
##
## INFO: applying ksvF0 to 12 segments/events
##
|
| | 0%
|
|====== | 8%
|
|============ | 17%
|
|================== | 25%
|
|======================= | 33%
|
|============================= | 42%
|
|=================================== | 50%
|
|========================================= | 58%
|
|=============================================== | 67%
|
|==================================================== | 75%
|
|========================================================== | 83%
|
|================================================================ | 92%
|
|======================================================================| 100%ggplot(td) +
aes(x = times_rel, y = T1, col = labels, group = sl_rowIdx) +
geom_line()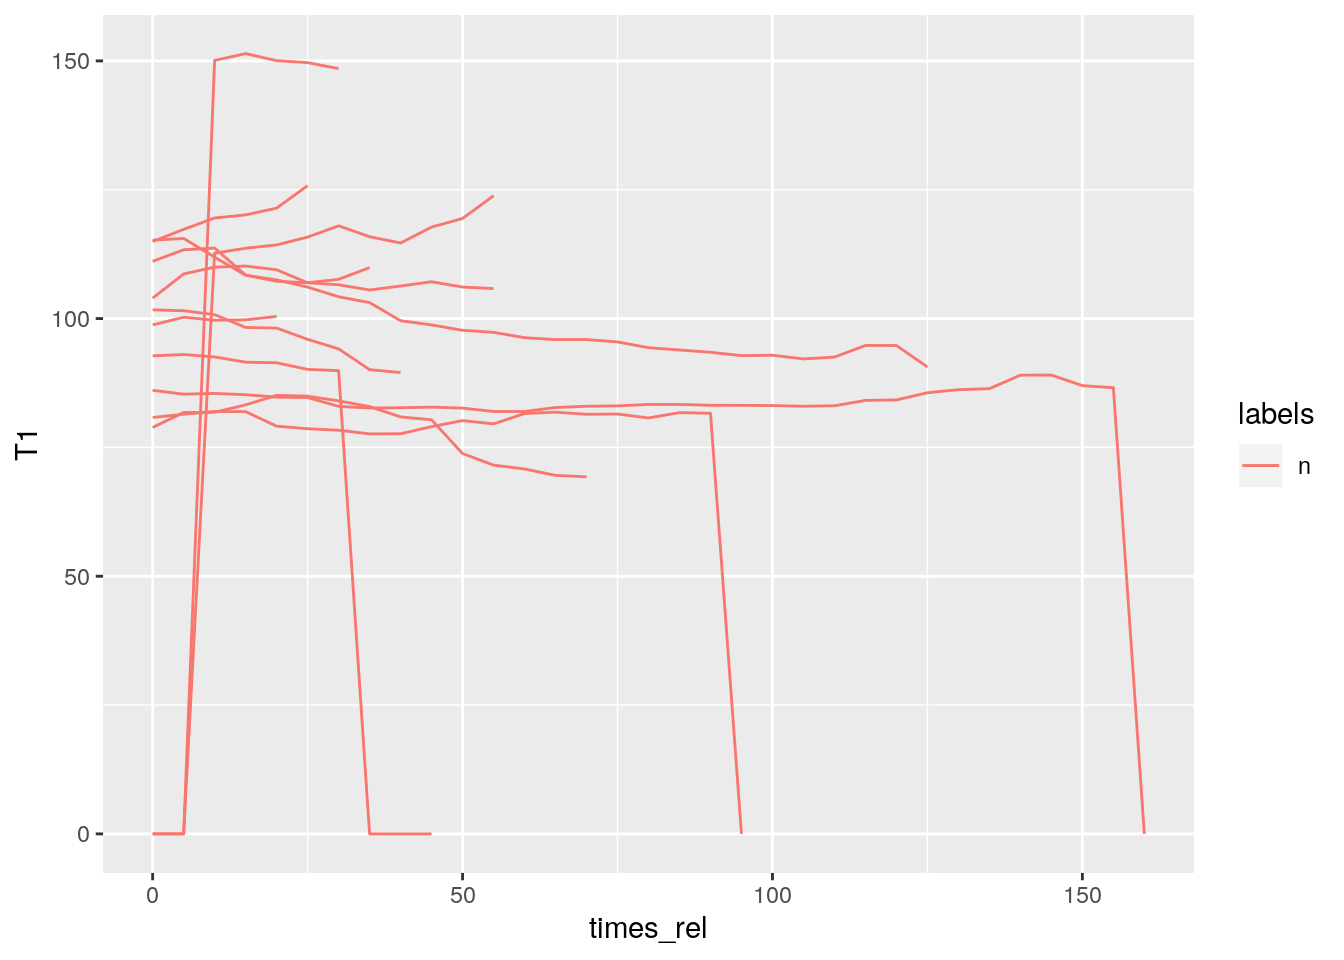
- Q: Plot the time normalized F2 contours contained in the fm track of every ‘n’ segment on the Phonetic level.
- A:
sl = query(db, "Phonetic == n")
td = get_trackdata(db, seglist = sl, ssffTrackName = "fm")
##
## INFO: parsing 12 fms segments/events
##
|
| | 0%
|
|====== | 8%
|
|============ | 17%
|
|================== | 25%
|
|======================= | 33%
|
|============================= | 42%
|
|=================================== | 50%
|
|========================================= | 58%
|
|=============================================== | 67%
|
|==================================================== | 75%
|
|========================================================== | 83%
|
|================================================================ | 92%
|
|======================================================================| 100%# either:
ggplot(td) +
aes(x = times_norm, y = T2, col = labels, group = sl_rowIdx) +
geom_line()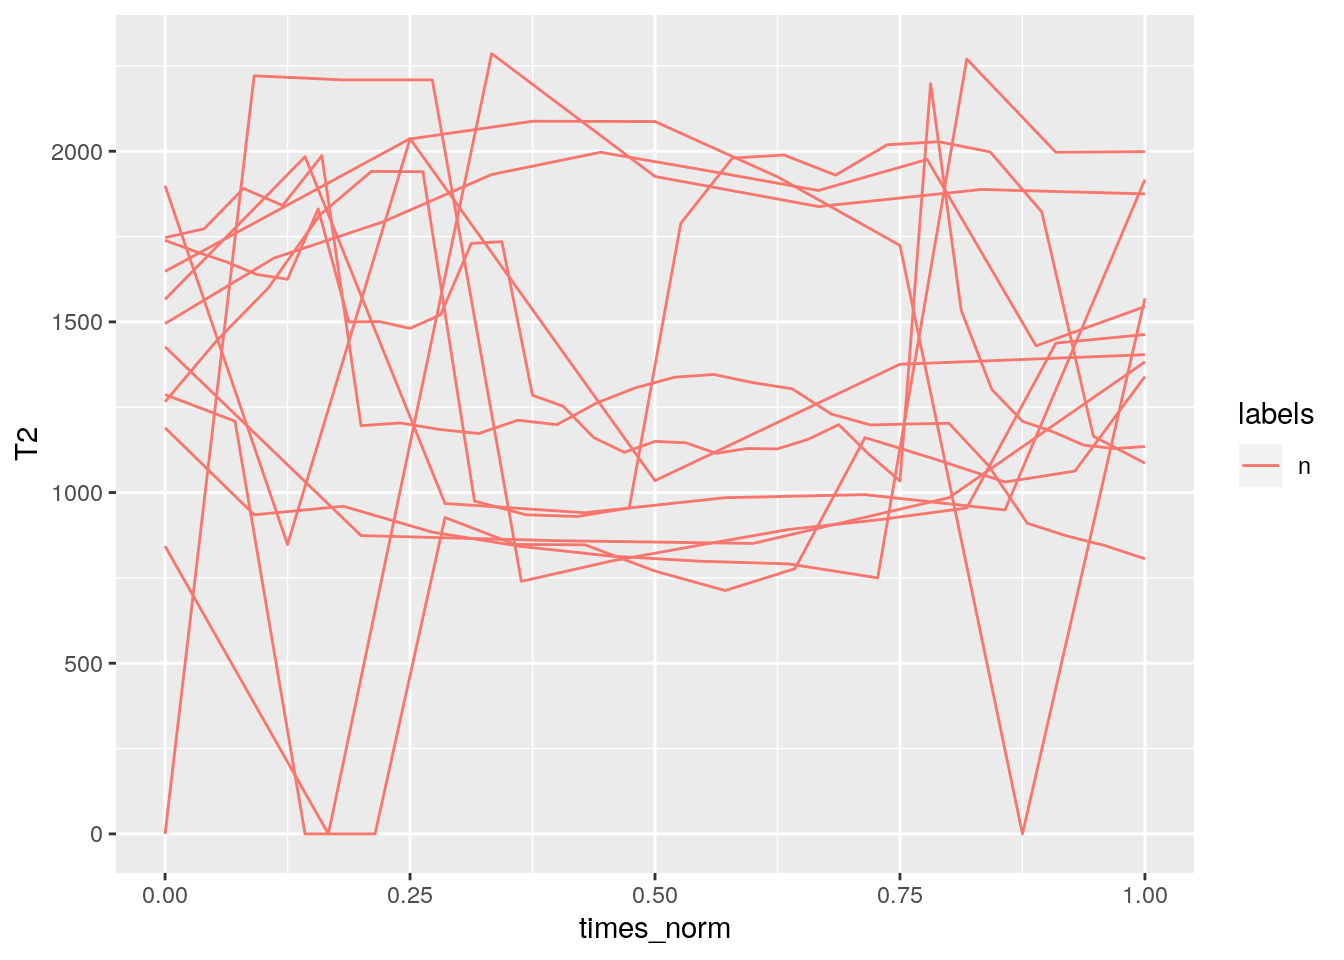
# or:
td_norm = normalize_length(td)
## Warning: Row indexes must be between 0 and the number of rows (10). Use `NA` as row index to obtain a row full of `NA` values.
## This warning is displayed once per session.## Warning: Row indexes must be between 0 and the number of rows (8). Use `NA` as row index to obtain a row full of `NA` values.
## This warning is displayed once per session.## Warning: Row indexes must be between 0 and the number of rows (20). Use `NA` as row index to obtain a row full of `NA` values.
## This warning is displayed once per session.## Warning: Row indexes must be between 0 and the number of rows (5). Use `NA` as row index to obtain a row full of `NA` values.
## This warning is displayed once per session.## Warning: Row indexes must be between 0 and the number of rows (12). Use `NA` as row index to obtain a row full of `NA` values.
## This warning is displayed once per session.## Warning: Row indexes must be between 0 and the number of rows (7). Use `NA` as row index to obtain a row full of `NA` values.
## This warning is displayed once per session.## Warning: Row indexes must be between 0 and the number of rows (6). Use `NA` as row index to obtain a row full of `NA` values.
## This warning is displayed once per session.ggplot(td_norm) +
aes(x = times_norm, y = T2, col = labels, group = sl_rowIdx) +
geom_line()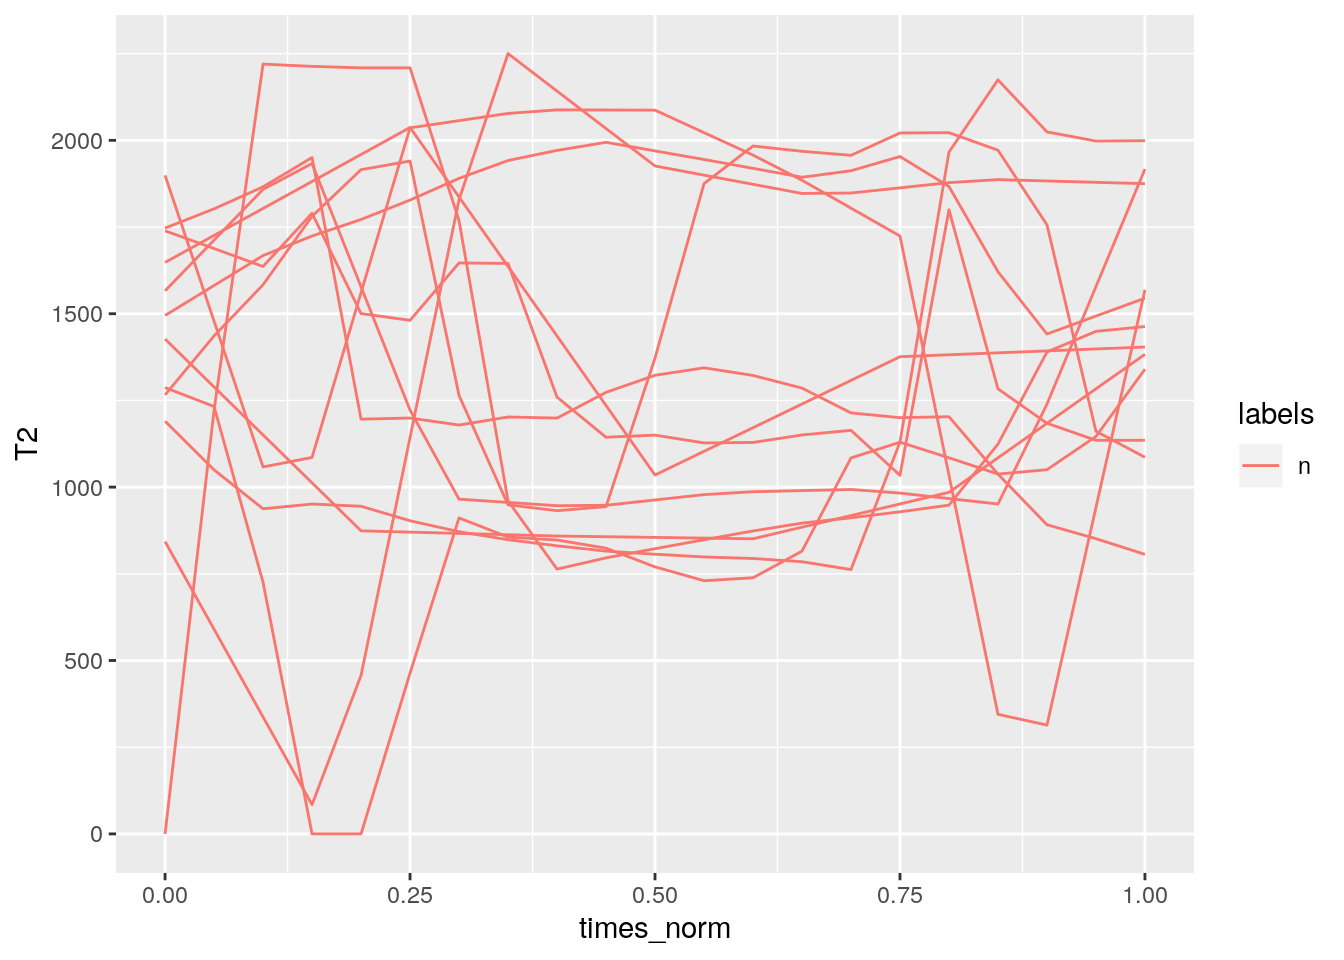
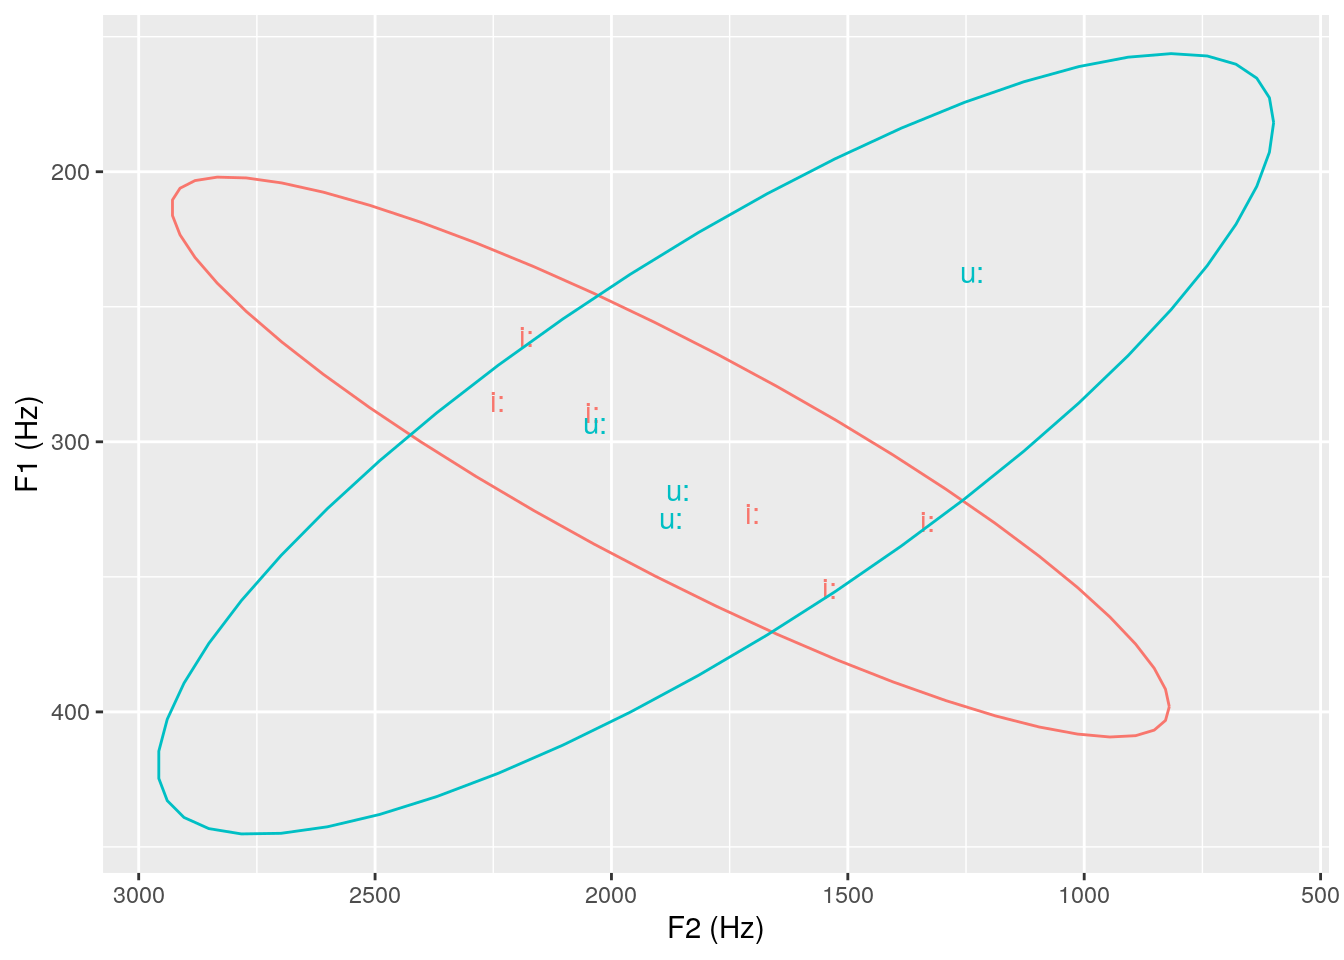
- Q: Plot a stat ellipse formant plot (F1-F2) of the i: and u: vowels at 20% of their normalized duration.
- A:
# place answer code here
sl = query(db, "Phonetic == i:|u:")
td = get_trackdata(db, seglist = sl, ssffTrackName = "fm")
##
## INFO: parsing 10 fms segments/events
##
|
| | 0%
|
|======= | 10%
|
|============== | 20%
|
|===================== | 30%
|
|============================ | 40%
|
|=================================== | 50%
|
|========================================== | 60%
|
|================================================= | 70%
|
|======================================================== | 80%
|
|=============================================================== | 90%
|
|======================================================================| 100%td_norm = normalize_length(td)
td_norm_20 = td_norm %>% filter(times_norm == 0.2)
ggplot(td_norm_20) +
aes(x = T2, y = T1, label = labels, col = labels) +
geom_text() +
stat_ellipse() +
scale_y_reverse() + scale_x_reverse() +
labs(x = "F2 (Hz)", y = "F1 (Hz)") +
theme(legend.position = "none")